MRI Helps Predict Preterm Birth

Cervical subglandular apparent diffusion coefficient (ADC) at MRI is associated with impending preterm birth in patients with a short sonographic cervix, according to new research published online in the journal, Radiology.
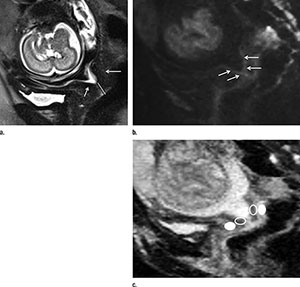
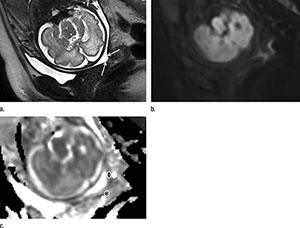
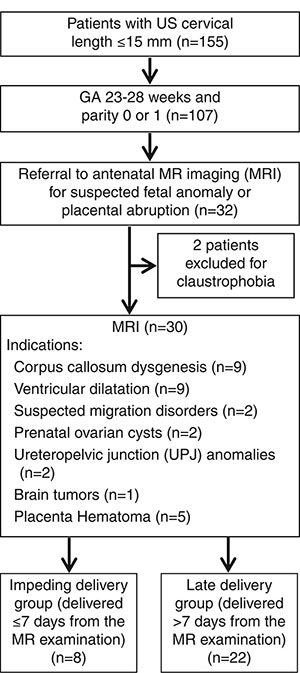
Gabriele Masselli, M.D., from Umberto I Hospital Sapienza University in Rome, Italy, and colleagues used pelvic 1.5-T MRI to study 30 pregnant women who had a sonographically short cervix. ADC values of the subglandular and stromal cervix, and the difference between both, were correlated to the interval to delivery.
Eight (27 percent) of the 30 patients delivered within six or seven days after MRI, and 22 (73 percent) of them delivered between 18 and 89 days after imaging. Overall, 19 (63 percent) of the patients experienced preterm delivery after less than 32 weeks of gestation.
“Our results indicate that a high ADC recorded at the level of the subglandular area of the cervix is associated with imminent delivery in asymptomatic patients who have a short cervix. This can be particularly useful in the acute care of patients who have a sonographically short cervix and positive fetal fibronectin test results in the early third trimester of pregnancy,” the authors write.


Web Extras
- Access the study, "Are Second Trimester Apparent Diffusion Coefficient Values of the Short Uterine Cervix Associated with Impending Preterm Delivery?" at pubs.rsna.org/doi/full/10.1148/radiol.2016150670