Regional Factors May Impact Imaging Patterns
The correlation between imaging use—including overuse—and geographic region could lead to more targeted reforms to reduce overuse of imaging and improve imaging quality and overall patient care


Two recent studies showing a correlation between imaging use—including overuse—and geographic region could lead to more targeted reforms to reduce overuse of imaging and improve imaging quality and overall patient care, as opposed to"one-size-fits all" interventions.
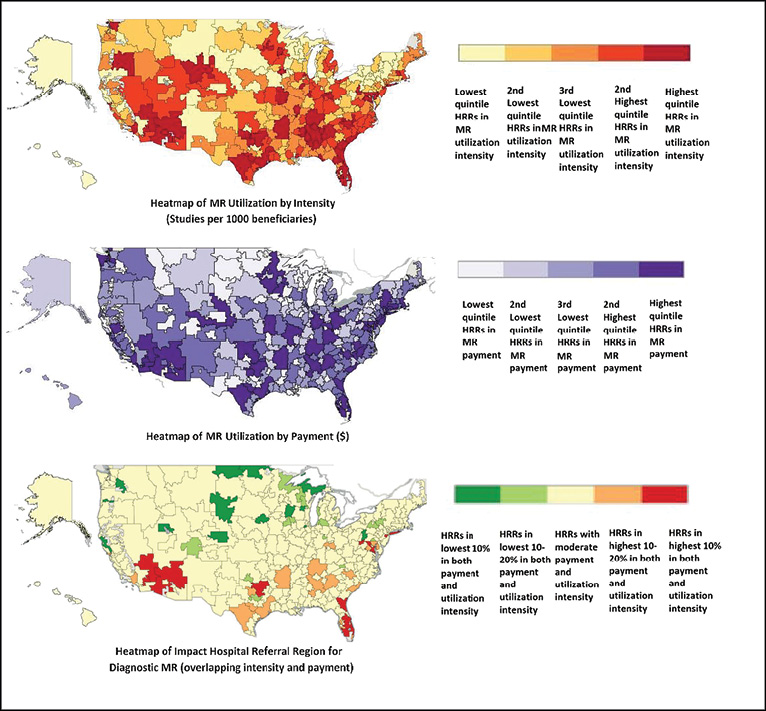
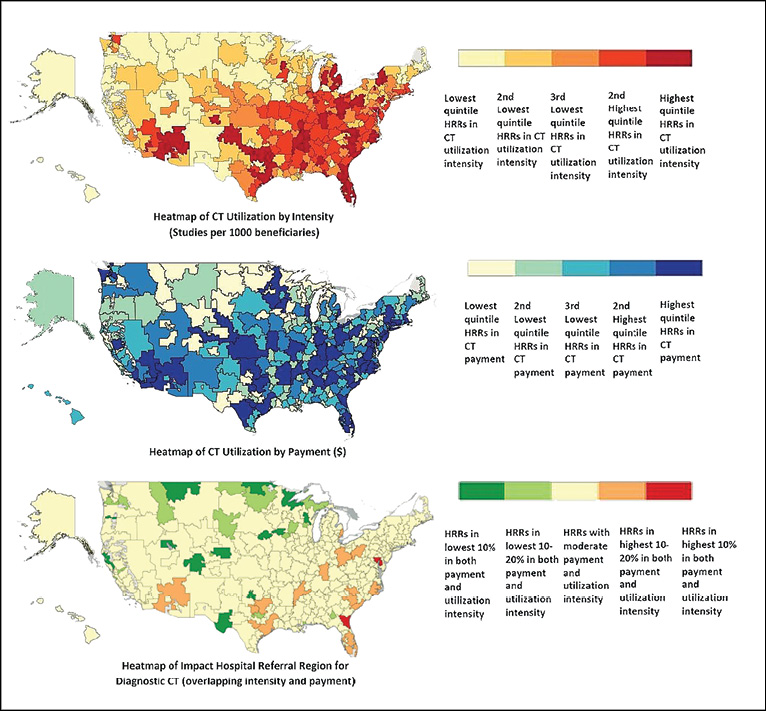
In a study published online in February 2015 in the journal of Radiology, researchers from Brigham and Women’s Hospital, Boston, used a newly available public database from the Centers for Medicare and Medicaid Services to examine geographic variation in providers’ use of CT and MR, after adjusting for imaging referral across hospital referral regions (HRRs). Beneficiary and service counts, provider charges, Medicare-allowed amounts and payments, place of service, provider type and Medicare participation indicator were included. Researchers examined 124 million unique diagnostic imaging services (totaling $5.6 billion in Medicare payments) performed for 34 million Medicare beneficiaries across 306 HRRs.
"In our research, we drilled down to each imaging study at the provider level, making the data more transparent and accessible," said lead researcher Ivan Ip, M.D., M.P.H., an internist at Brigham and Women’s.
Dr. Ip and colleagues examined procedures per capita in each HRR and also developed an imaging referral index (IRI) to account for patients who crossed region boundaries. Researchers also measured utilization intensity, which they defined as the number of examinations per 1,000 beneficiaries.
For CT, the average unadjusted utilization intensity ranged from 226.8 per 1,000 beneficiaries in the lowest geographic area to 792.1 studies per 1,000 beneficiaries in the highest geographic area. After adjusting for IRI, the utilization intensity range narrowed from 330.4 studies per 1,000 beneficiaries in the lowest area to 684 per 1,000 beneficiaries in the highest.
For MRI, the average unadjusted utilization intensity ranged from 75.6 studies per 1,000 Medicare beneficiaries in the lowest area to 286.6 per 1,000 beneficiaries in the highest area; after adjustment, the intensity range narrowed from 105 studies per 1,000 beneficiaries in the lowest area to 256 per 1,000 beneficiaries in the highest area.
High-impact HRRs, those in the highest deciles for both adjusted intensity and payment, included two regions for CT: Jacksonville, Florida, and Baltimore. There were 11 high-impact HRRs for MRI: Fort Myers, Ft. Lauderdale, Orlando and Jacksonville, Florida; Dallas; Palm Springs–Rancho Mirage, California; Las Vegas; Washington, D.C.; New Brunswick, New Jersey; East Long Island, New York; and Phoenix.
The most common CT procedure in the two high-impact HRRs was head and/or brain CT; the most common MRI procedure in the 11 high-impact HRRs was lumbar spine MRI.
Identifying Variations, Not Causes, Was Study Goal
Rather than attempting to determine causes, researchers sought to simply shed light on variations in radiologic procedure patterns, Dr. Ip said. "One of the problems is that providers often do not know that they practice significantly differently from their colleagues next door. Our mission is to bring transparency to this issue."
While previous studies have documented provider practice variations, this study delved further into the details, Dr. Ip said. "The more granular the data, the more actionable it is," he said. "For example, saying, ‘We should decrease the number of CT scans’ is far different than saying, ‘We do more than double the CT pulmonary angiography in patients presenting with chest pain versus our comparison hospital.’"
Wide variations across HRRs in specific procedures may create an opportunity to focus on each clinical scenario, Dr. Ip said. As opposed to broad national campaigns, researchers suggest using more targeted interventions focusing on providers that order or perform the most common procedures in the highest impact regions as a way of realizing necessary change.
"We see an effective, targeted approach as a local provider-led initiative in which stakeholders are involved in the design, execution and monitoring of the process," Dr. Ip said.
Study Shows Region-Level Association in Breast, Prostate Imaging
Another recent study demonstrated a correlation between inappropriate imaging by HRR region in breast cancer and prostate cancer patients.
Authors of the study published in the March 2015 issue of the Journal of the American Medical Association (JAMA) Oncology used American Society of Clinical Oncology standards to determine inappropriate imaging, garnering a broad sample from the Surveillance, Epidemiology and End Results (SEER) Medicare-linked database.
Using Medicare data, researchers identified more than 9,000 men with low-risk prostate cancer and more than 30,000 women with low-risk breast cancer diagnosed between 2004 and 2007, classified by region. Results showed high rates of inappropriate imaging for both: 44.4 percent for prostate cancer and 41.8 percent for breast cancer.
The study also demonstrated an association at the regional level in rates of inappropriate imaging of low-risk prostate cancer imaging and low-risk breast cancer imaging patients—suggesting that regional culture and infrastructure contribute to healthcare utilization patterns across diseases. These findings contrast with the Institute of Medicine position that individual-level decisions, rather than geography, drive regional healthcare spending variation.
Radiologists should use this data to reflect on potential biases within their region, said study author James B. Yu, M.D., M.H.S., a radiation oncologist at Yale University School of Medicine. "The regional variation likely has a lot do with practice mix, relative pressures and entrenched patterns of care," Dr. Yu said. "A lot of the way people approach medicine is local."
Ultimately, understanding whether prostate and breast cancer imaging are associated at a regional level might promote more nuanced, regionally tailored interventions—such as educational initiatives—to improve population health and provide higher-value care, the authors said. Further research to determine the reasons for these regional patterns is necessary, Dr. Yu added.


Web Extras
- Access the Radiology study, "Use of Public Data to Target Variation in Providers’ Use of CT and MR Imaging among Medicare Beneficiaries," at RSNA.org/Radiology
- Access the JAMA study, "Regional-Level Correlations in Inappropriate Imaging Rates for Prostate and Breast Cancers Potential Implications for the Choosing Wisely Campaign," at jamanetwork.com